Case Studies
Web Portal For Storage Display And Analysis Of Clean Air Data

Our customer is the one of the most premier educational institutions in India. They are engaged in development of centralized database for air quality in India. The database should allow the users to upload air quality data from anywhere in India and visualize trends. The final goal was to provide access of this data to public. It was decided to use web-based
portal for the input and visualization of data with hierarchical access given to the project managers. Zeus Numerix was engaged as it possessed the technologies for cloud-based portal, visualization algorithms, and portal management.
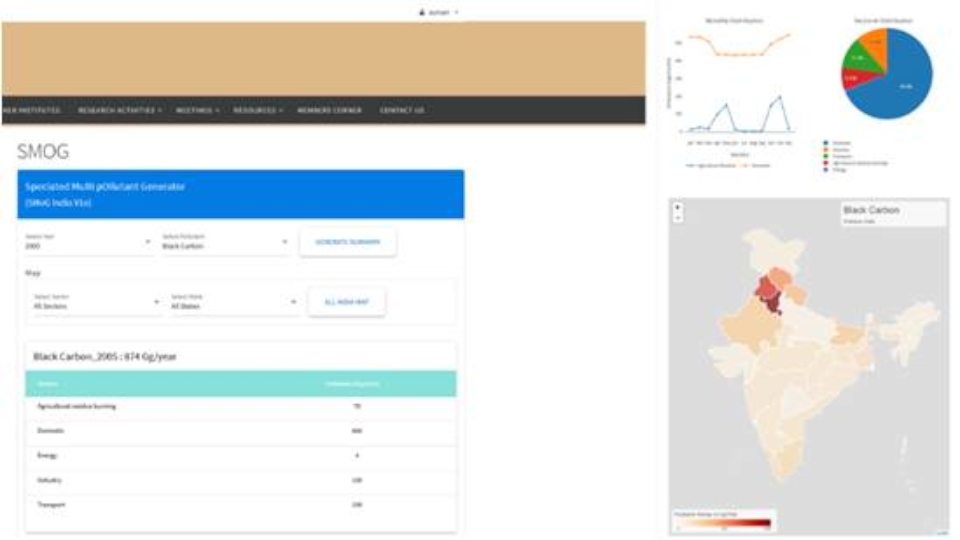
Zeus Numerix first designed a framework for uploading of data. Since the data was received in different formats, it was standardized. Web portal was checked for hierarchical access with dummy data. Various logins were created for superuser who can input and modify data, admin user who can input data and various levels of users who can visualize data. Visualization algorithms were coded
for display of data for pie charts scatter plots, time series, bar charts, histograms, spatial (geographical areas) plots, 3D plots, vector fields, surface and mesh plots, and volume visualization etc. Statistical analysis tools like Regression, Principal Component Analysis, filtering of data, data cleaning (such as removal of outliers), clustering, data projection, time series analysis tools, etc. are coded to aid in decision making.
The customer was delivered a web portal with password protected access to pages and data. The database is amenable to parallel processing for rigorous analysis. Modularity has been built-in to integrate programs by other researchers. The web portal would be made available to the public globally once final testing is complete


